

Nearly 85 million households in the U.S. that own pets want to live where their beloved companions can enjoy long, healthy lives without breaking the bank. The American Pet Products Association projects that in 2018, pet ownership will cost Americans over $72 billion.
Years ago, pet owners had access to only a handful of businesses offering animal services and supplies. Petco and PetSmart were among the biggest names. But the market for pet businesses is growing to fill increasing consumer demand. For example, in 2017, the pet food industry grew three times as fast as the packaged food industry. And there are new ways to buy goods for your animal, such as monthly subscription boxes.
Adding an animal to the family can be hard on the wallet. A long list of expenses that include licenses, grooming and medical care can cost between $227 to more than $2,000 annually, depending on the type of animal. Health insurance alone can exceed $200 per year for a dog, and it may not even be worth it. And if you rent an apartment with an animal, you can expect to pay hundreds, if not thousands, more for a pet deposit, fee and rent.
With animal parents in mind, WalletHub compared the pet-friendliness of the 100 largest U.S. cities across 24 key metrics. Their data set ranges from minimum pet-care provider rate per visit to pet businesses per capita to walkability. Scroll down for the winners and a full description of their methodology for determining these rankings:
Most Pet-Friendly Cities
|
Overall Rank* |
City | Total Score | ‘Pet Budget’ Rank | ‘Pet Health & Wellness’ Rank |
‘Outdoor Pet-Friendliness’ Rank |
|---|---|---|---|---|---|
| 1 | Scottsdale, AZ | 60.48 | 80 | 1 | 4 |
| 2 | Orlando, FL | 58.35 | 14 | 4 | 46 |
| 3 | San Diego, CA | 58.10 | 78 | 3 | 6 |
| 4 | Austin, TX | 56.20 | 33 | 2 | 58 |
| 5 | Phoenix, AZ | 56.00 | 49 | 13 | 16 |
| 6 | Tampa, FL | 55.41 | 30 | 20 | 19 |
| 7 | Cincinnati, OH | 55.31 | 4 | 32 | 29 |
| 8 | Seattle, WA | 54.49 | 86 | 6 | 11 |
| 9 | Las Vegas, NV | 54.44 | 63 | 16 | 10 |
| 10 | Irvine, CA | 54.34 | 96 | 5 | 5 |
| 11 | Portland, OR | 54.29 | 83 | 11 | 7 |
| 12 | Atlanta, GA | 53.13 | 21 | 10 | 80 |
| 13 | Albuquerque, NM | 52.85 | 6 | 79 | 20 |
| 14 | Sacramento, CA | 52.58 | 48 | 26 | 21 |
| 15 | Plano, TX | 52.28 | 70 | 9 | 35 |
| 16 | Columbus, OH | 52.05 | 1 | 63 | 56 |
| 17 | Los Angeles, CA | 51.77 | 97 | 12 | 3 |
| 18 | Oakland, CA | 51.55 | 85 | 18 | 9 |
| 19 | Long Beach, CA | 50.98 | 77 | 24 | 12 |
| 20 | St. Louis, MO | 50.91 | 32 | 33 | 41 |
| 21 | Fremont, CA | 50.79 | 94 | 19 | 2 |
| 22 | Denver, CO | 50.79 | 81 | 7 | 50 |
| 23 | Tucson, AZ | 50.78 | 42 | 23 | 42 |
| 24 | Fort Worth, TX | 50.68 | 11 | 30 | 73 |
| 25 | Colorado Springs, CO | 50.61 | 74 | 25 | 14 |
| 26 | Oklahoma City, OK | 50.42 | 2 | 69 | 82 |
| 27 | Stockton, CA | 49.95 | 12 | 89 | 39 |
| 28 | Henderson, NV | 49.86 | 51 | 67 | 8 |
| 29 | Miami, FL | 49.79 | 15 | 35 | 64 |
| 30 | Arlington, TX | 49.40 | 20 | 46 | 59 |
| 31 | Birmingham, AL | 49.27 | 44 | 34 | 52 |
| 32 | Madison, WI | 49.23 | 43 | 48 | 30 |
| 33 | Raleigh, NC | 49.08 | 27 | 21 | 85 |
| 34 | San Antonio, TX | 48.90 | 8 | 60 | 63 |
| 35 | Tulsa, OK | 48.77 | 7 | 59 | 75 |
| 36 | Boise, ID | 48.66 | 50 | 47 | 37 |
| 37 | Kansas City, MO | 48.38 | 22 | 51 | 55 |
| 38 | Anaheim, CA | 48.30 | 90 | 8 | 40 |
| 39 | Glendale, AZ | 48.21 | 31 | 42 | 60 |
| 40 | Omaha, NE | 48.15 | 3 | 77 | 68 |
| 41 | St. Petersburg, FL | 48.05 | 40 | 73 | 24 |
| 42 | San Francisco, CA | 47.98 | 100 | 14 | 1 |
| 43 | North Las Vegas, NV | 47.46 | 51 | 81 | 22 |
| 44 | Pittsburgh, PA | 47.18 | 60 | 55 | 27 |
| 45 | Riverside, CA | 47.07 | 82 | 36 | 28 |
| 46 | Hialeah, FL | 47.03 | 24 | 75 | 61 |
| 47 | Lexington-Fayette, KY | 46.93 | 35 | 41 | 83 |
| 48 | Chula Vista, CA | 46.76 | 53 | 70 | 32 |
| 49 | Minneapolis, MN | 46.72 | 66 | 44 | 36 |
| 50 | Chicago, IL | 46.45 | 89 | 15 | 49 |
| 51 | Jersey City, NJ | 46.38 | 92 | 31 | 18 |
| 52 | Reno, NV | 46.09 | 54 | 28 | 76 |
| 53 | Gilbert, AZ | 46.03 | 75 | 22 | 69 |
| 54 | Garland, TX | 45.93 | 56 | 38 | 66 |
| 55 | Corpus Christi, TX | 45.87 | 5 | 91 | 86 |
| 56 | Louisville, KY | 45.84 | 16 | 53 | 94 |
| 57 | San Jose, CA | 45.81 | 39 | 84 | 25 |
| 58 | Irving, TX | 45.76 | 45 | 37 | 93 |
| 59 | Toledo, OH | 45.74 | 9 | 76 | 57 |
| 60 | St. Paul, MN | 45.48 | 58 | 66 | 38 |
| 61 | Houston, TX | 45.46 | 46 | 45 | 71 |
| 62 | Wichita, KS | 44.72 | 18 | 58 | 98 |
| 63 | Nashville, TN | 44.56 | 37 | 62 | 78 |
| 64 | San Bernardino, CA | 44.50 | 67 | 85 | 15 |
| 65 | New Orleans, LA | 44.49 | 72 | 43 | 53 |
| 66 | Aurora, CO | 44.44 | 65 | 29 | 77 |
| 67 | Chesapeake, VA | 44.32 | 61 | 86 | 26 |
| 68 | Bakersfield, CA | 44.07 | 79 | 68 | 34 |
| 69 | Winston-Salem, NC | 44.06 | 25 | 80 | 89 |
| 70 | Greensboro, NC | 44.05 | 19 | 74 | 62 |
| 71 | Durham, NC | 44.03 | 26 | 65 | 90 |
| 72 | Dallas, TX | 43.97 | 84 | 40 | 47 |
| 73 | Chandler, AZ | 43.75 | 59 | 49 | 67 |
| 74 | Indianapolis, IN | 43.60 | 23 | 56 | 97 |
| 75 | Washington, DC | 43.39 | 98 | 50 | 17 |
| 76 | Santa Ana, CA | 43.37 | 95 | 17 | 54 |
| 77 | Lubbock, TX | 43.16 | 29 | 87 | 91 |
| 78 | Boston, MA | 43.16 | 69 | 72 | 44 |
| 79 | Memphis, TN | 43.14 | 17 | 78 | 99 |
| 80 | Philadelphia, PA | 43.08 | 88 | 61 | 33 |
| 81 | Lincoln, NE | 43.03 | 38 | 90 | 65 |
| 82 | Jacksonville, FL | 42.95 | 41 | 71 | 84 |
| 83 | Baton Rouge, LA | 42.82 | 36 | 54 | 95 |
| 84 | El Paso, TX | 42.77 | 28 | 98 | 45 |
| 85 | Anchorage, AK | 42.48 | 71 | 95 | 23 |
| 86 | Milwaukee, WI | 42.04 | 13 | 96 | 81 |
| 87 | Detroit, MI | 41.92 | 34 | 93 | 70 |
| 88 | Virginia Beach, VA | 41.30 | 47 | 82 | 87 |
| 89 | Cleveland, OH | 41.14 | 55 | 83 | 79 |
| 90 | New York, NY | 41.05 | 99 | 39 | 13 |
| 91 | Fresno, CA | 40.94 | 76 | 88 | 43 |
| 92 | Charlotte, NC | 40.34 | 57 | 52 | 96 |
| 93 | Newark, NJ | 40.28 | 93 | 27 | 92 |
| 94 | Norfolk, VA | 40.11 | 61 | 94 | 48 |
| 95 | Mesa, AZ | 39.35 | 87 | 64 | 74 |
| 96 | Baltimore, MD | 37.97 | 64 | 97 | 51 |
| 97 | Laredo, TX | 37.26 | 9 | 99 | 72 |
| 98 | Fort Wayne, IN | 37.06 | 68 | 57 | 100 |
| 99 | Buffalo, NY | 36.92 | 73 | 92 | 88 |
| 100 | Honolulu, HI | 32.95 | 91 | 100 |
31 |
*No. 1 = Most Pet-Friendly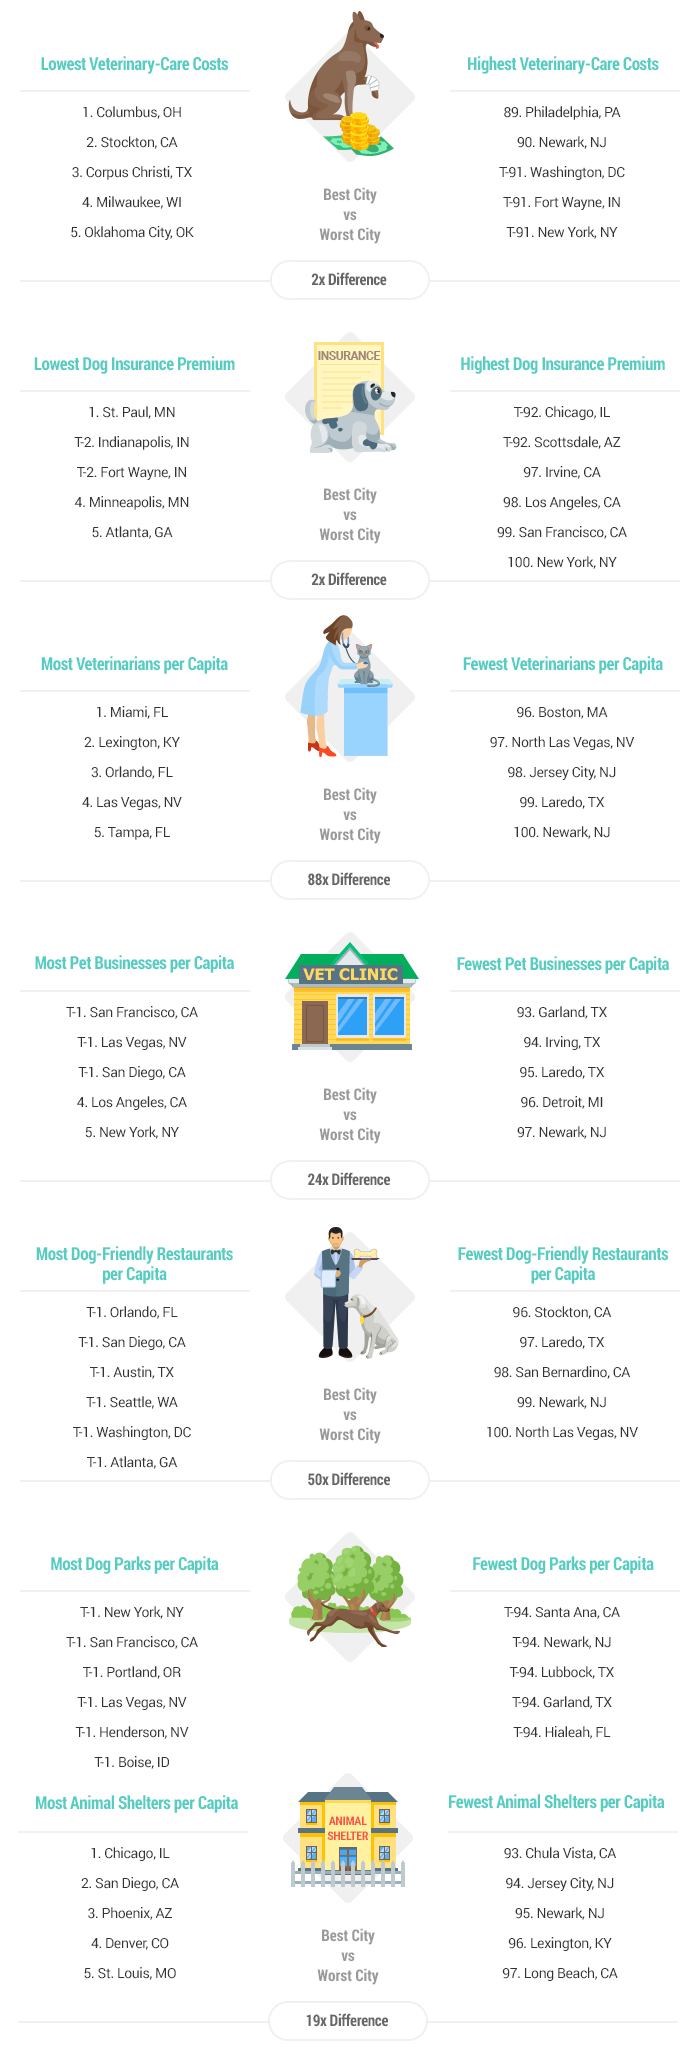
Methodology
In order to determine the most pet-friendly places in America, WalletHub compared the 100 most populated cities across three key dimensions: 1) Pet Budget, 2) Pet Health & Wellness and 3) Outdoor Pet-Friendliness.
They evaluated those dimensions using 24 relevant metrics, which are listed below with their corresponding weights. Each metric was graded on a 100-point scale, with a score of 100 representing the most favorable conditions for pets and their owners. Data for metrics marked with an asterisk (*) were available at the state level only. For metrics marked with an asterisk (**), the square root of the population was used to calculate the population size in order to avoid overcompensating for minor differences across cities.
Finally, they determined each city’s weighted average across all metrics to calculate its overall score and used the resulting scores to rank-order their sample – which considers only the city proper in each case and excludes cities in the surrounding metro area.
Pet Budget – Total Points: 25
- Veterinary Care Costs: Full Weight (~10.00 Points)
- Minimum Pet-Care Provider Rate per Visit: Half Weight (~5.00 Points)
- Dog Insurance Premium: Full Weight (~10.00 Points)
Pet Health & Wellness – Total Points: 50
- Veterinarians per Capita**: Full Weight (~3.51 Points)
- Pet Caretakers per Capita**: Full Weight (~3.51 Points)
- Animal Trainers per Capita**: Full Weight (~3.51 Points)
- Pet Businesses per Capita**: Full Weight (~3.51 Points)
- Dog-Friendly Restaurants per Capita**: Full Weight (~3.51 Points)
- Share of Pet-Friendly Hotels: Quarter Weight (~0.88 Points)
- Dog-Friendly Shops per Capita**: Full Weight (~3.51 Points)
- Pet Meetup Groups per Capita**: Full Weight (~3.51 Points)
- Doggie Daycare & Boarding Establishments per Capita**: Full Weight (~3.51 Points)
- Pet-Friendliness of Rental Market: Full Weight (~3.51 Points)
Note: This metric measures the percentage of pet-friendly rental units. - Average Home Square Footage: Full Weight (~3.51 Points)
- Share of Single-Family Detached Homes: Full Weight (~3.51 Points)
- Share of Homes with One or Fewer Occupants per Room: Full Weight (~3.51 Points)
- Animal Shelters per Capita**: Full Weight (~3.51 Points)
- Strength of Animal Protection Laws: Full* Weight (~3.51 Points)
Note: This metric is based on the Animal Legal Defense Fund’s “Best & Worst States for Animal Protection Laws” ranking.
Outdoor Pet-Friendliness – Total Points: 25
- Weather: Full Weight (~4.55 Points)
Note: This metric is based on WalletHub’s “Cities with the Best & Worst Weather” ranking. - Dog Parks per Capita**: Full Weight (~4.55 Points)
- Parkland as Share of City Area: Full Weight (~4.55 Points)
- Walk Score: Full Weight (~4.55 Points)
- Dog-Friendly Trails per Capita**: Full Weight (~4.55 Points)
- Dog Shows per Capita**: Half* Weight (~2.27 Points)
Resources:
Sources: Data used to create this ranking were collected from the U.S. Census Bureau, Bureau of Labor Statistics, Yelp.com, Zillow, WalkScore.com, TripAdvisor, RentPath, Pets Best Insurance Services, Council for Community and Economic Research, Center for Neighborhood Technology, Sittercity, BringFido, InfoDog, Trust for Public Land, Animal Legal Defense Fund, Meetup and WalletHub research.